3. Debugging Tools
According to the description in Section 2, the ARTPlugin plugin system provides two human-machine interaction channels: a dashboard and command-based interface. However, ROS2’s interfaces require program-level integration to enable normal interaction, and ROS2 itself does not provide a convenient human-machine interaction interface. Moreover, users learning to use plugins or debugging often need the robot to perform simple motions first before proceeding to more advanced tasks. To address this, Faou provides an easy-to-use visual interaction tool to help users get started with the ARTPlugin system.
3.1. Debugging tool launched
The three most critical aspects of user interaction mentioned above are: status dashboard human-machine interaction, action command human-machine interaction, and servo debugging human-machine interaction. For these three aspects, corresponding HMI debugging tools are provided in sequence: the first is the topic monitor built into rqt, while the second and third are dedicated debugging software—fairino_debug_tool—developed specifically for the plugin.
First, navigate to the /opt/fairino_art_plugin directory and run the runrqttool.sh script located in this directory. You will then see three software windows pop up sequentially.
Topic Monitor Interface:
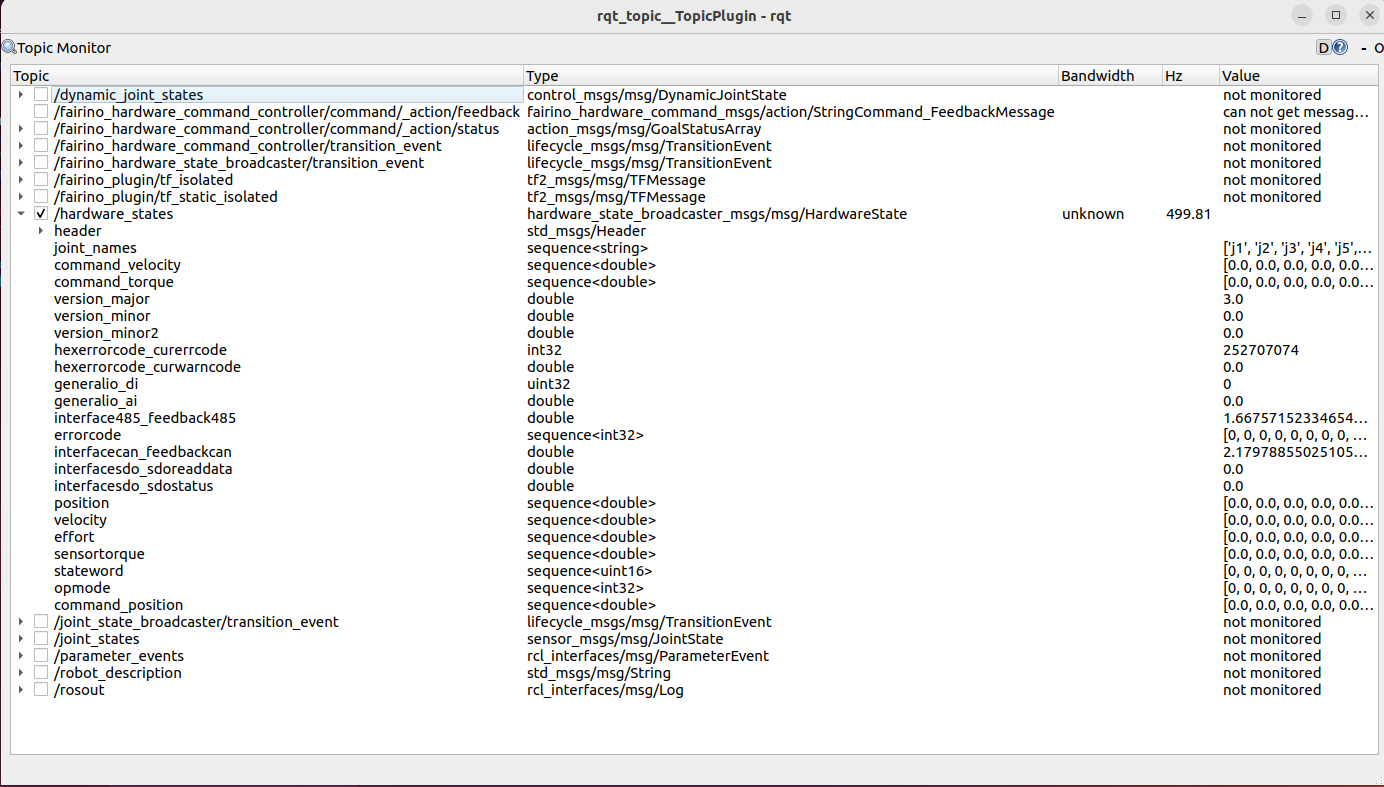
Figure 3-1 Status Dashboard
Select the “hardware_state” topic in the Topic list to view the full status published by the plugin.
Action Debug Interface:
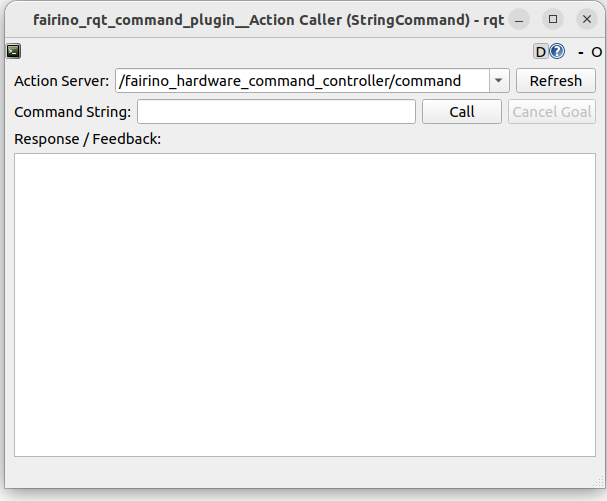
Figure 3-2 Action Command Debugging Tool
In this interface, clicking “Refresh” automatically refreshes the action server list. Select the action server “fairino_hardware_command_controller/command”, then enter the command string in the text box next to “Command String”. Click “Call” to send the command; the result of the command execution will be displayed in the text box below.
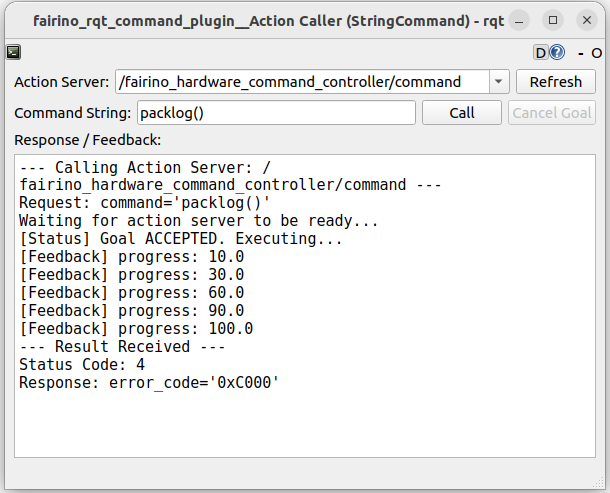
Figure 3-3 Action Command Debugging Tool: Command Transmission and Reception
Multi-joint Debugging Tool:
This tool can load the joint_trajectory_controller and perform position tuning on the joints associated with the controller. First, at least one joint_trajectory_controller must be activated, which can be achieved using the previous action command debugging tool.
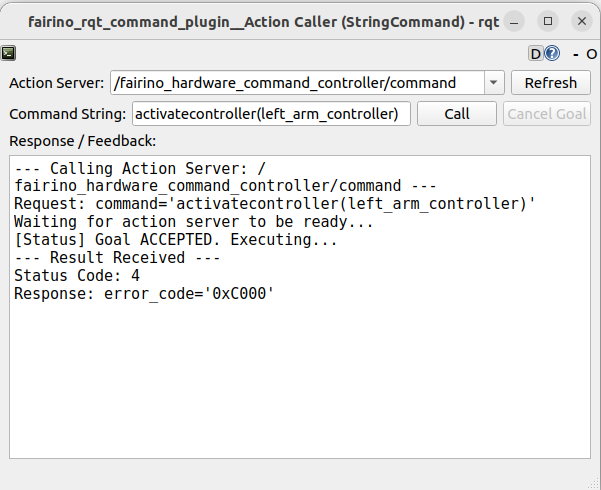
Figure 3-4 Activate left_arm_controller
Then click the Refresh List button on the Multi-Joint Debugging Tool page to see the newly activated controller.
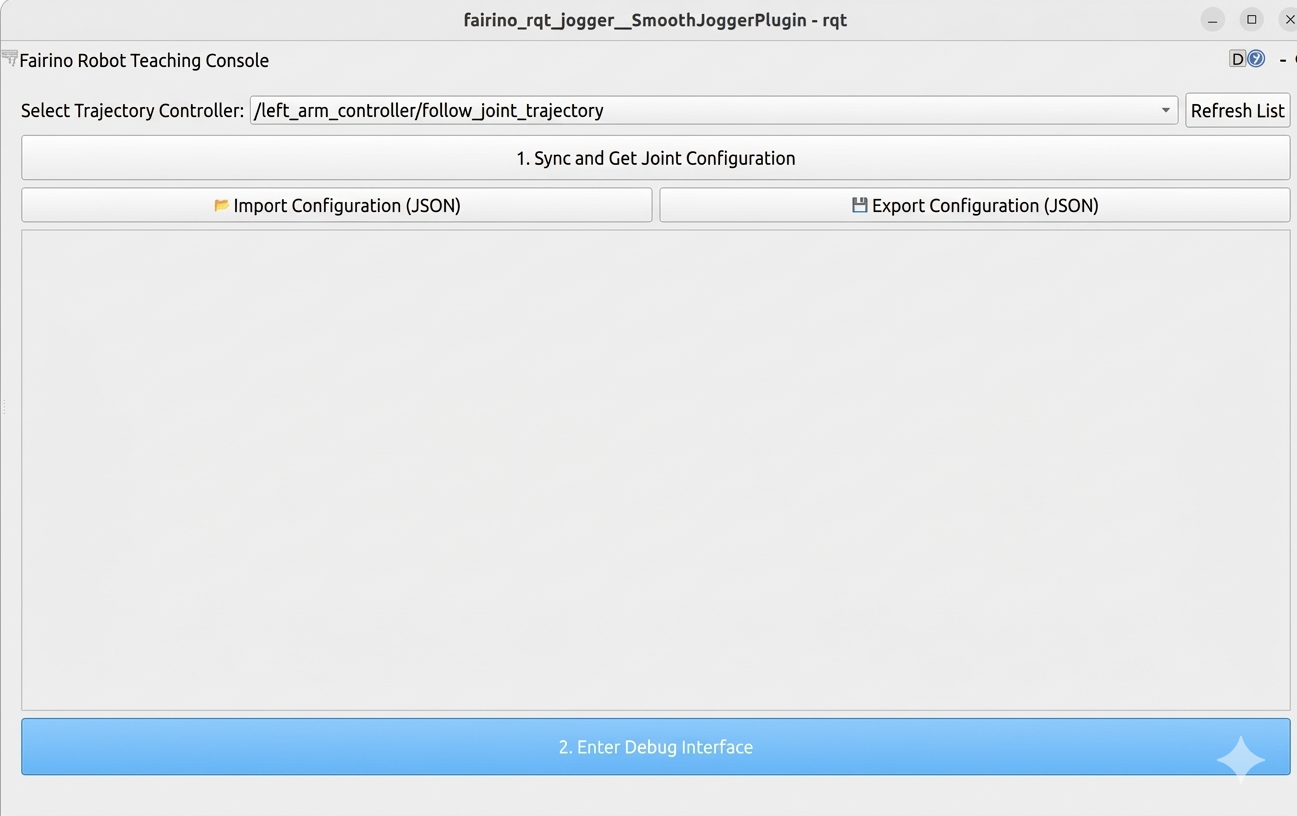
Figure 3-5: Page that obtains the controller
Click “Synchronize and Retrieve Joint Configuration” to obtain the joint names and quantity associated with this controller; users can set the limit positions and maximum speed for each joint.
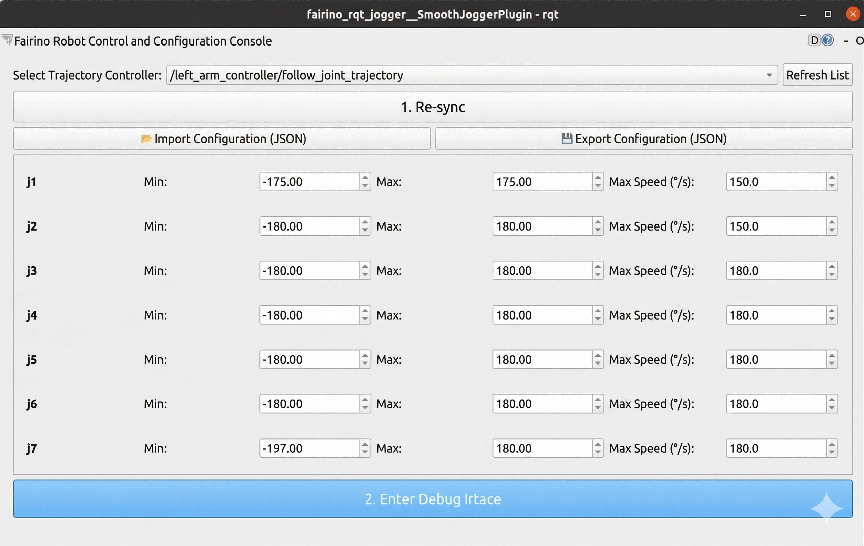
Figure 3-6 Configuration Interface
After configuration is complete, click to enter the debugging interface to access the main interface, which synchronizes the actual positions of the current servo joints. Users can manually refresh the current actual positions to the interface by clicking “Synchronize Position.”
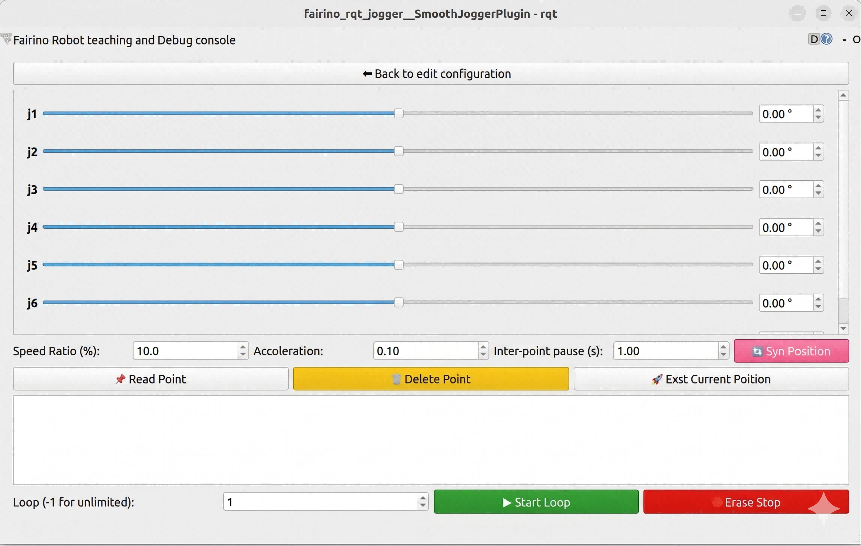
Figure 3-7 Motion Debugging Interface
Features supported on this page:
The user manually adjusts the joint sliders to set the desired target joint positions, then clicks “Execute at Current Position.” The joints then move along spline-planned trajectories to reach their target positions. The user can adjust the motion speed using a velocity scaling factor and an acceleration value (in rad/s²).
Click “Record Point” to save the current position as a teaching point. After recording multiple points, click “Start Loop” to cycle sequentially among the teaching points. By adjusting the pause duration between points, users can set the dwell time between consecutive teaching points. Users can delete a selected teaching point by clicking “Delete Point.”
Whether clicking “Execute Current Position” or “Start Loop,” the robotic arm’s motion can be immediately halted in place via emergency stop.
3.2. Configuration Tool Usage
In V3.0.3 and later versions, the key configuration information in the plugin is centrally managed by the configuration tool. This makes it convenient for users to centrally maintain system parameters, reducing configuration complexity. Through the standalone configuration tool, users can centrally modify types such as DOMAIN_ID and DDS, changing the previous practice where modifying parameters required delving into scripts or configuration files in the project directory to modify them one by one, where a careless mistake could cause format errors and result in bricking.
Enter the /opt/fairino_art_plugin directory, run the runconfigeditor.sh script in this directory, and you can see the main interface of the configuration editor, as shown in the figure below:
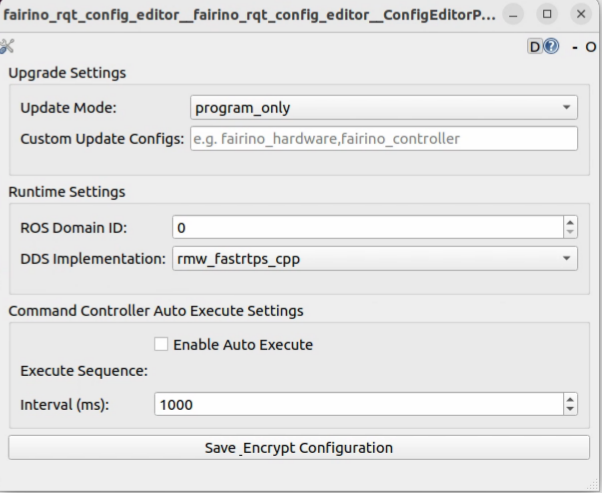
Chart 3-8 Configuration Editor Main Interface
Interface upgrade settings area is the : for setting upgrade configuration items
Update Mode is the upgrade mode selection, options are all,program_only and custom, all means during the upgrade, the program and yaml configuration files in the upgrade package will both be overwritten to the file directory, so not only the software executable files will be updated, but all yaml configuration files will also be overwritten. Program_only is only updating the software executable files, configuration files remain unchanged in the current software version ;
Custeom update config will read the content in the text box when custom is enabled, and the upgrade program will only update the configuration file of the user-specified ros2 feature package, with everything else remaining unchanged.
Runtime Settings is used to set the ROS_DOMAIN_ID and DDS types. Previously, setting these two data required modifying the values in the startup service script and the rqttool.sh script. Now, you only need to configure them in this interface, no need to set them anywhere else.
Command Controller Auto Execut Setting is the part used for configuring boot auto-execute instructions in fairino_hardware_command_controller, previously you needed to manually write a yaml configuration file in the install folder of command_controller, now you only need to check Enable Auto Execute to boot up, after clicking, a Add command button will appear below, clicking the button allows you to add the auto-execute instruction function name and parameters.